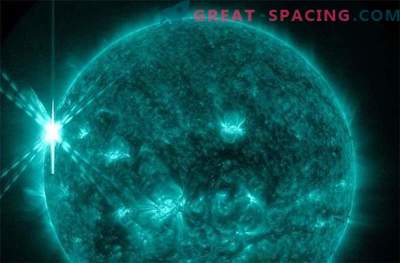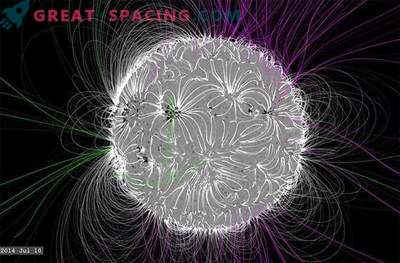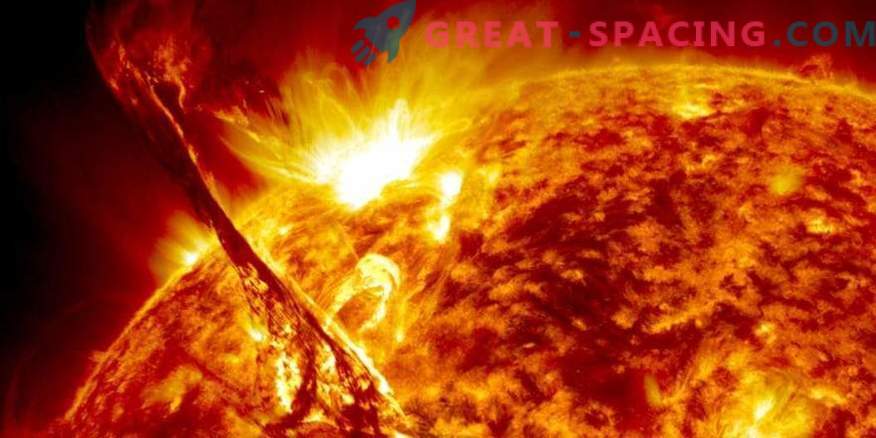
For the first time, researchers used a single computer model to simulate the entire life cycle of a solar flare: from the accumulation of energy thousands of kilometers under the surface of the Sun to the appearance of entangled magnetic field lines breaking out as a bright flare.
This visualization provides the basis for future models of the Sun, allowing real-time simulations of star weather, including the formation of sunspots, which periodically lead to flares and coronal mass ejections. These eruptions are dangerous, as they can damage power grids and communication networks, as well as disable satellites and threaten the lives of astronauts.
In the new study, the complex simulator records the formation of a solar flare more realistically than previous attempts. In addition, it includes the emission spectrum of light associated with flares. The work allows us to explain the type of flares not only at the visible wavelength, but also at ultraviolet, extreme ultraviolet wavelengths and x-rays.
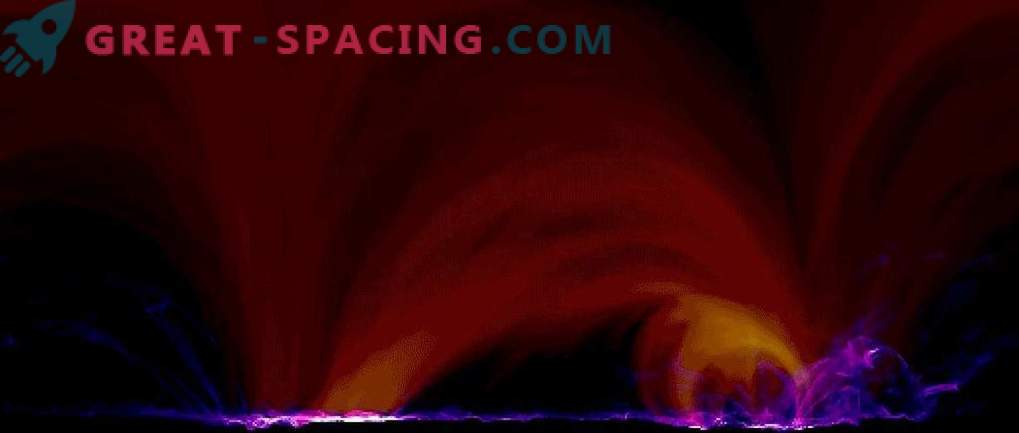
The visualization demonstrates a solar flare modeled in a new study. Violet marked plasma with a temperature of less than 1 million. Kelvin. Red color indicates heating of 1-10 million Kelvin, and green - above 10 million. Kelvin
Scale coverage of the solar layers
For the new research it was necessary to form a solar model that would extend to several areas of the star, reflecting the complex and unique behavior of each. The created model begins in the upper part of the convection zone (10,000 km below the surface of the Sun), rises through the surface and extends 40,000 km into the solar atmosphere (the corona). The model clearly demonstrates the differences in gas density, pressure and other characteristics of the star.
To create a successful solar flare model, it was necessary to add detailed equations that allowed each region to contribute to the development of the flare in a realistic way. But it was also important not to make it too difficult to work on a supercomputer. Therefore, they used the mathematical technique that is used to study the Earth’s magnetosphere and other planets. This made it possible to compress the difference in time scales between the layers without loss of accuracy. Next, it was necessary to create a script on the simulated Sun. In the new model, they wanted to see if it could generate a flash on their own (usually scientists are waiting for a real flash and then plugging in the model). The researchers began by creating the active spot conditions observed in March 2014. In fact, this spot created dozens of flares, including an extremely powerful X-class and three moderate M-classes. Scientists did not try to exactly recreate the spot of 2014, but tried to match the components that were present in that event.
It turned out that the new model was able to cover the whole process: from the accumulation of energy to the appearance on the surface, the rise in the corona, activation and release in the form of a flash. Now scientists are planning to test the model on real observations of our star.


